

•Good for site install test
•Not possible to test 4/5G multi band PIM issues.
•Expensive tower climb, out of service test •Measures CW PIM, cannot identify impact to modulated carriers
•Intrusive test , can introduce PIM!

•Useful for identifying exact location of PIM on site.
•Labour intensive, manual process
•You need to be close to the PIM source to find it!

•Low cost, remote test
•Indicates you MIGHT have PIM
•Requires site visit to diagnose/rectify
All of these methods are tried and tested ways to find SOME PIM Current PIM test methods are either limited in capability or costly to use
Operators for whom PIM is not the focus
•Operators who check KPIs and network metrics and state they have no PIM in their networks.
•Operators where the cost of investigating PIM is prohibitively expensive, live with the problem rather than fix it.
•Operators for whom the option of PIM Cancellation is seen as a solution BUT PIM Cancellation can only be used where you understand what PIM you need to fix!
•Operators who cannot test PIM due to regulatory restrictions on swept CW transmissions
Operators who are investing in addressing pim
•Operator procedures to check for PIM on installation and tools to check for PIM in live networks.
•Active work to allocate spectrum and optimize network design
•Investment in network equipment that can in specific cases mitigate PIM (RRH with active cancellation)
All networks have PIM to a greater or lesser extent. PIM is dynamic and constantly changing.
The real issue is that today it is very difficult to quantify the financial impact of PIM at a site. If you cannot quantify the impact, why try to fix it? How do you know any fix offers an ROI?

*a very brief outage (few mins) to install an optical tap, if applicable.
**Supports all 3GPP bands, except millimetric bands.

As there is no service disruption with PIMForensics, surveying the cell site can now be done either when investigation is required or during normal periodic maintenance

Surveying the site to understand the cost of PIM, drives cost effective solutions to PIM
Optical tap
•Inserted into the CPRI link between BBU and RRU. The optical tap may be pre-installed in some networks or can be supplied with the sensor
•During installation of the tap into the optical link, there will be a short interruption on the CPRI link to service, following which the network will continue to operate, supporting live traffic, as before.
•The required optical signals are fed from tap to sensor.
IQ sensor
•The sensor collects base band IQ data from the downlink band(s) which are causing the PIM and the uplink band suffering from PIM.
•Baseband IQ data preserves all the information in the RF link, just in digitised form, so any measurement that could be made at an RF connection can also be done by processing baseband IQ data.
•It will simultaneously capture all MIMO antennas.
•The captured IQ data is processed on a laptop.
GUI
•The set up, measurement control, display of results and report generation are under control of the GUI running on the laptop.
PIM Algorithm (patented)
•The algorithm, which identifies and measures the PIM, runs on the laptop under control of the GUI.
•It measures the level of PIM, even in the presence of UL traffic, thermal noise and any other interference.


Building a PIM model allows a level of analysis far beyond a simple examination of the uplink spectrum.
•The PIM can be monitored through time as the downlink and uplink traffic levels vary.
•Low level PIM can be identified, regardless of the level of uplink traffic.
•The contribution to the PIM from individual MIMO transmit antennas can be identified aiding the diagnosis of PIM faults.
PIM source diagnosis.This is a two step process:
1.Heat Map: Uses the individual antenna contributions to indicate the likely source and position of those dominant PIM sources that are internal to the RF network or in the immediate vicinity of the antennas
2. Distance Measurement: Uses a power delay profile, similar to that used by an RF PIM tester,to report the distance between antenna calibration point and dominant PIM source.

Configuration is in two stages:
•Stage 1 – Configure the instrument for the environment it will work in(site info)
•Stage 2 – Configure the instrument for the test (test roster)
•To remove complexity AceAxis offers the option to load scripts to support test or to manually enter the information to support the test.
•Beta version of auto-discovery of CPRI + RF data is in development.
Site Information
Contains site specific information, fully editable within the GUI:-
•Site ID / name
•Lat, long, antenna beam width& azimuth (for PIM location)
•Carrier details – UL / DL center frequency, LTE bandwidth
•CPRI mapping – No. of antennas, AxC start number (typically 1,5 (2 ant)), max rate (supports all rates 1-8)
Test Roster
•For each site, the test roster will define the set of measurements to be made and in what order. The test roster is editable within the GUI
•For each sector within the site,one (or more) possible PIM scenarios are identified as likely to cause a problem and for each problem, the following are defined:
The specific band combination.
e.g. DL1=Band 17, DL2 = Band 14, UL1 = Band 17
The IM caused.
e.g. IM3 upper/lower
Once site info & test roster are configured and loaded. The tap and sensor can be connected, using the on-screen, colour-coded fibre diagram.
A configuration check is run to ensure correct fibre connectivity. The TSSI (DL) and RSSI (UL) levels will be displayed along with pass/fail.
Low traffic levels will require OCNS to be activated – this will be represented with low TSSI values (resulting in fail configuration check).
Uplink & Downlink spectrums can be viewed on the ‘analyser’ tab.

Once tap & sensor are configured PIM measurements for each UL antenna port can be performed.Six tabs display various useful information, each set of results can be saved to a report.

Displays (wanted) UL signal and PIM signal – changeable units, dBm & dBlsb (dB Full Scale, dB Least Significant Bit)

Displays PIM over time, useful for long-term monitoring, saves an ‘event log’ detailingtime/level when PIM exceeds pre-defined threshold.

CDF detailing percentage of time PIM exceeds threshold.
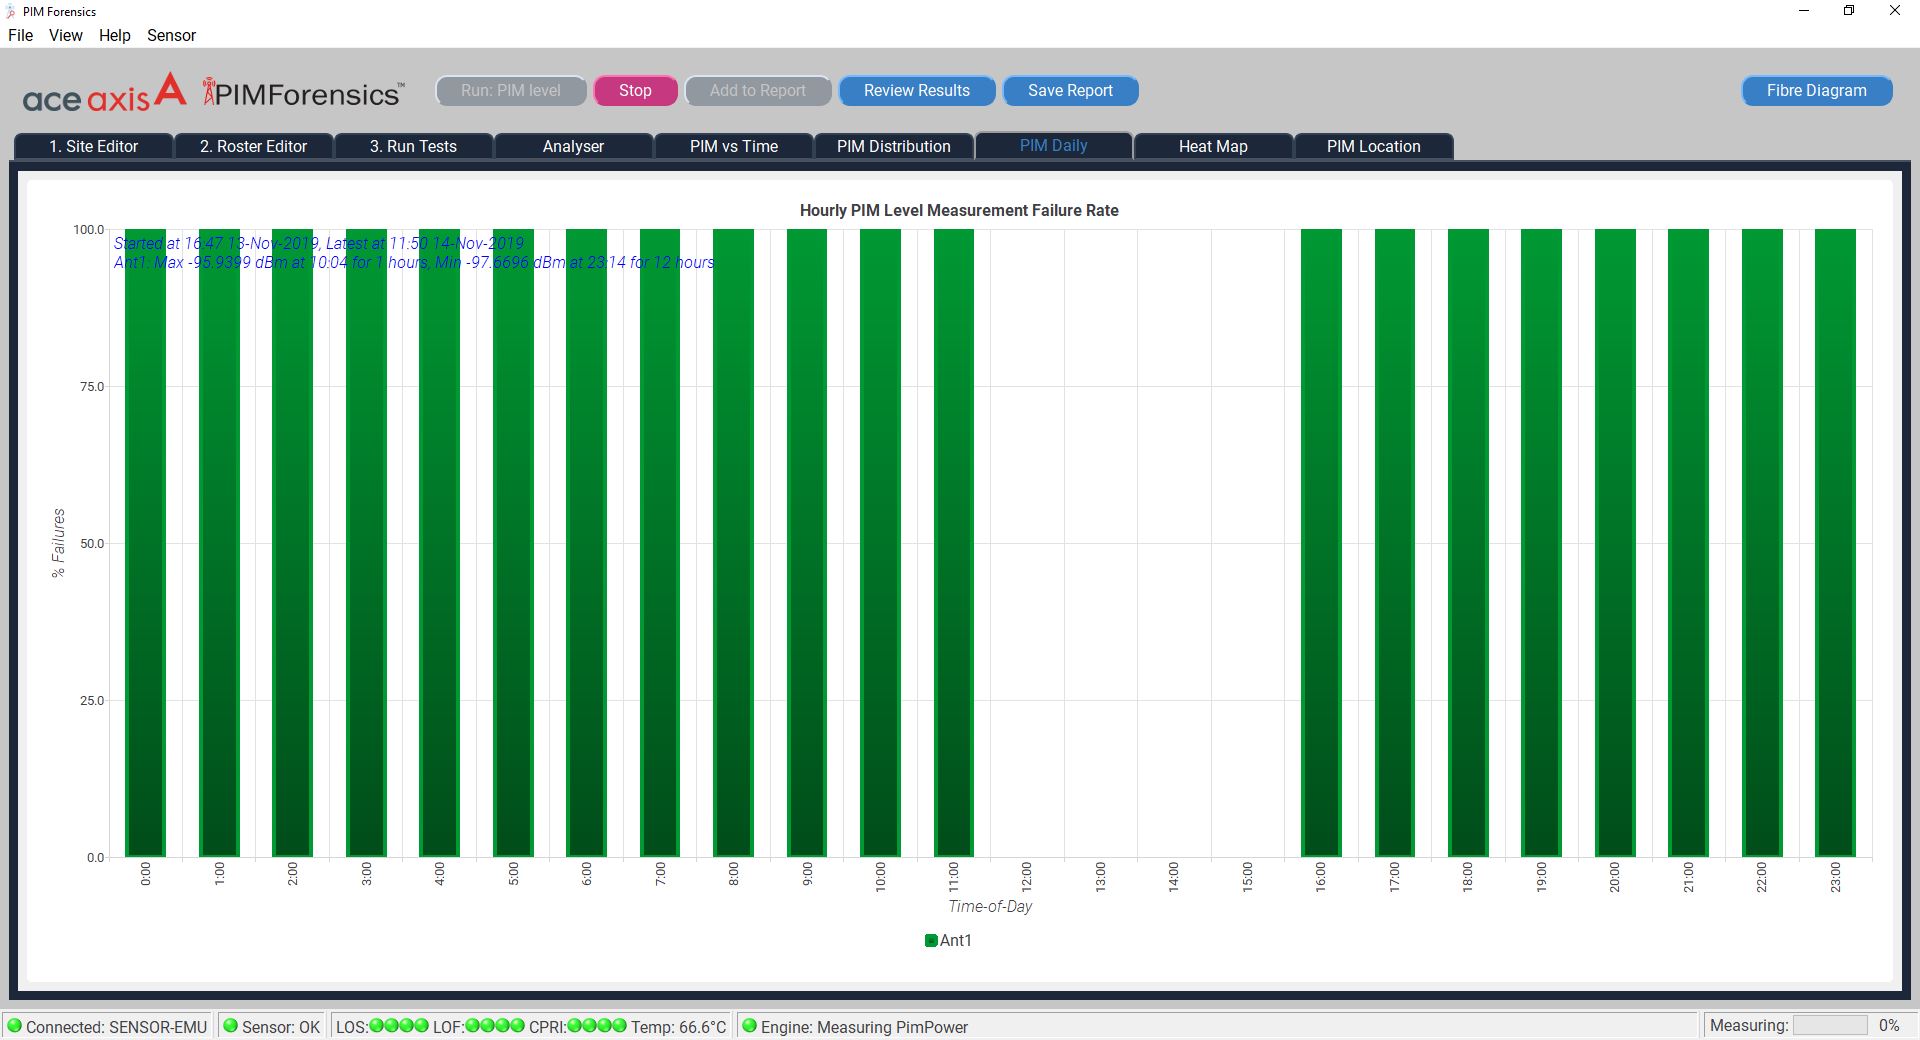
Bar chart displaying PIM counts exceeding threshold over a 24 hour period.
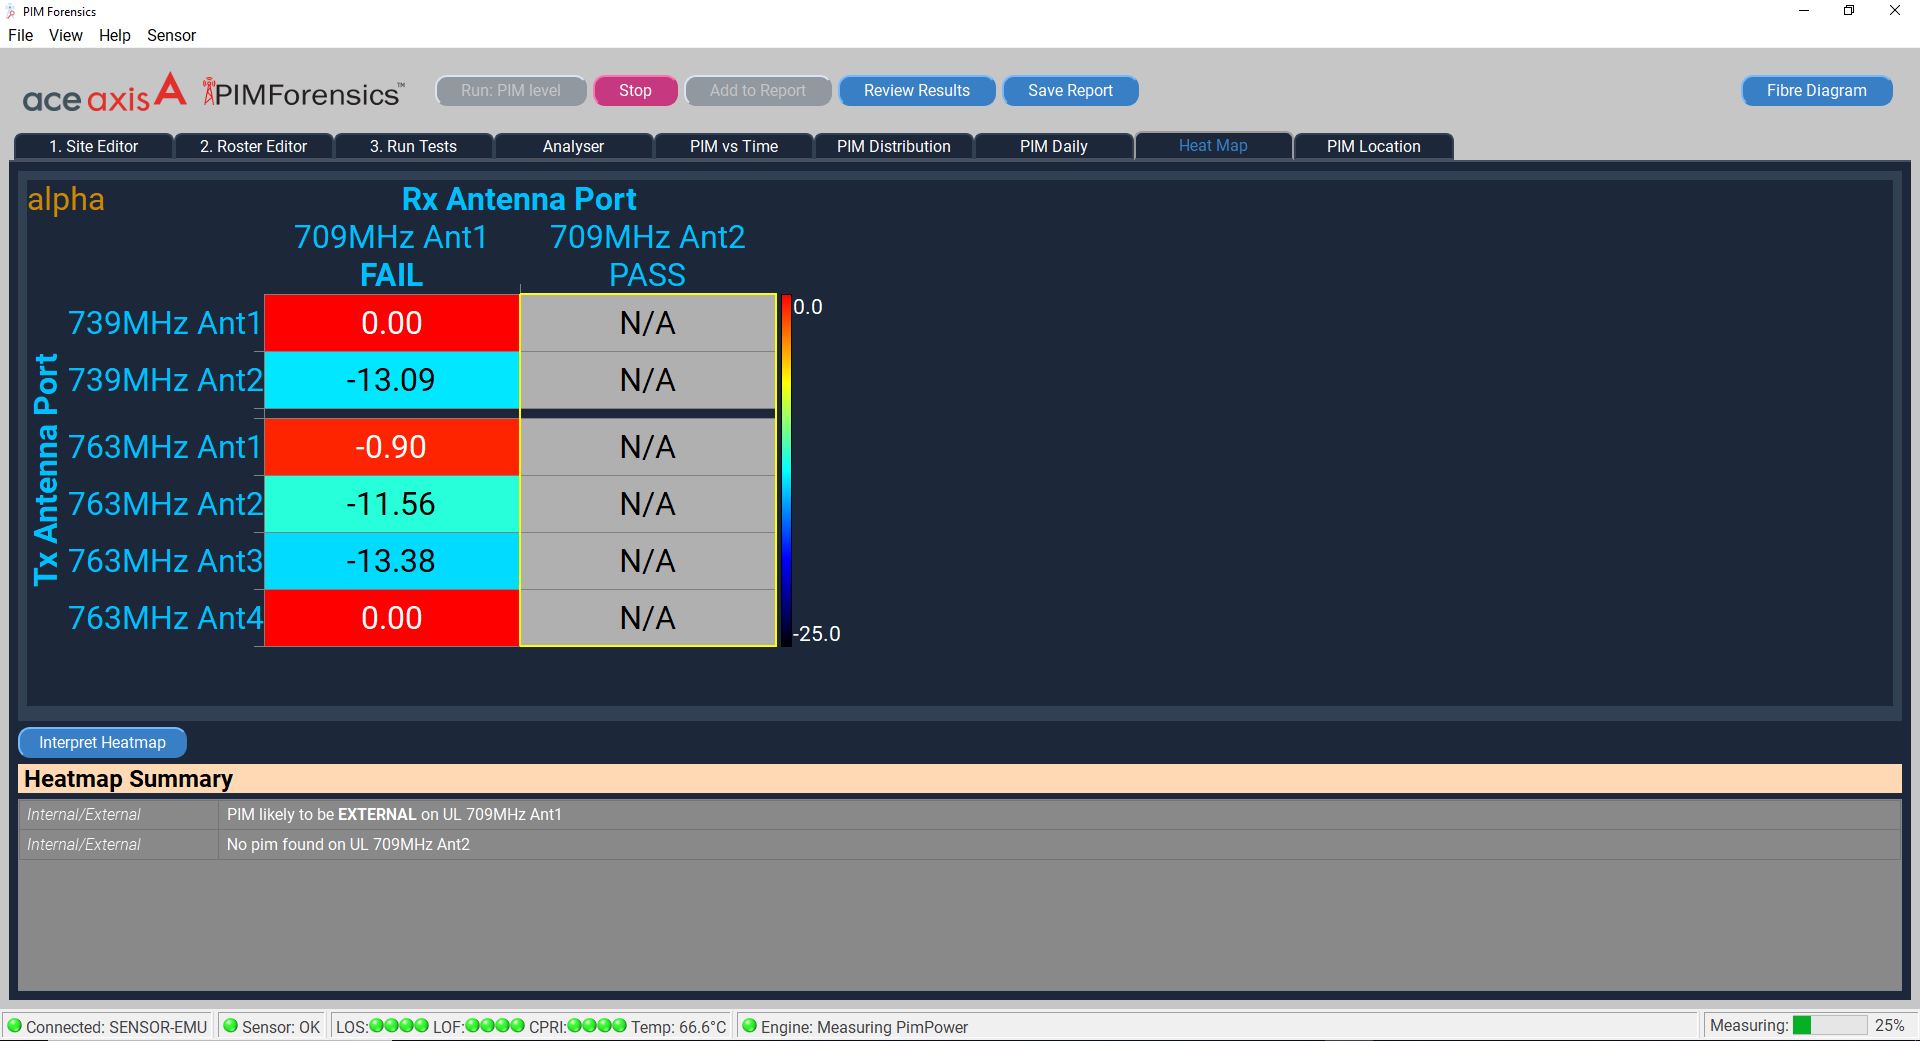
Intuitive display to help identify the potential source / location of PIM.

Distance of PIM source from a reference point (typically the antennaface).

New Insights+ Lower Costs + Zero Downtime = PIMForensics
Capex & Opex
1 – Passive test for PIM, no cell site down time, ROI measure of PIM
2 – One PIM over CPRI test box covers all RF bands (future proof)
3 –No certification testing needed, product is designed to be simple to use
4 – No need to calibrate the unit
Physical
1 –Tower base/ shelter test for PIM
2 –No need to power down site and disconnect RF cabling
3 –Equipment can be left at site for long term monitoring
4 –Testing can be performed at any time of the day
5 –Small sensor size and weight (2lb weight and 1.3L volume).
Measurement/ Measurement Accuracy
1 –Measures with live traffic providing the most accurate assessment of PIM impact to network
2 –Measures dBm or dB full scale to represent PIM magnitude directly related to the RF carriers under analysis.
3 –Measures PIM to below the noise floor.
4 –Measures single band PIM, multi band PIM and cross sector PIM, on site/off site PIM, PIM location
5 – Measures RF over CPRI